Portfolio
As of March 31, 2026
Portfolio at a Glance
We believe GBDC’s investment portfolio is conservatively positioned and composed of predominantly first lien, first out senior secured floating rate loans, which mitigate credit and interest rate risk.
- Nearly twice the diversification by obligor vs. the BDC peer average1,2
- Higher percentage of first lien loans vs. the BDC peer average1,3
Portfolio Composition
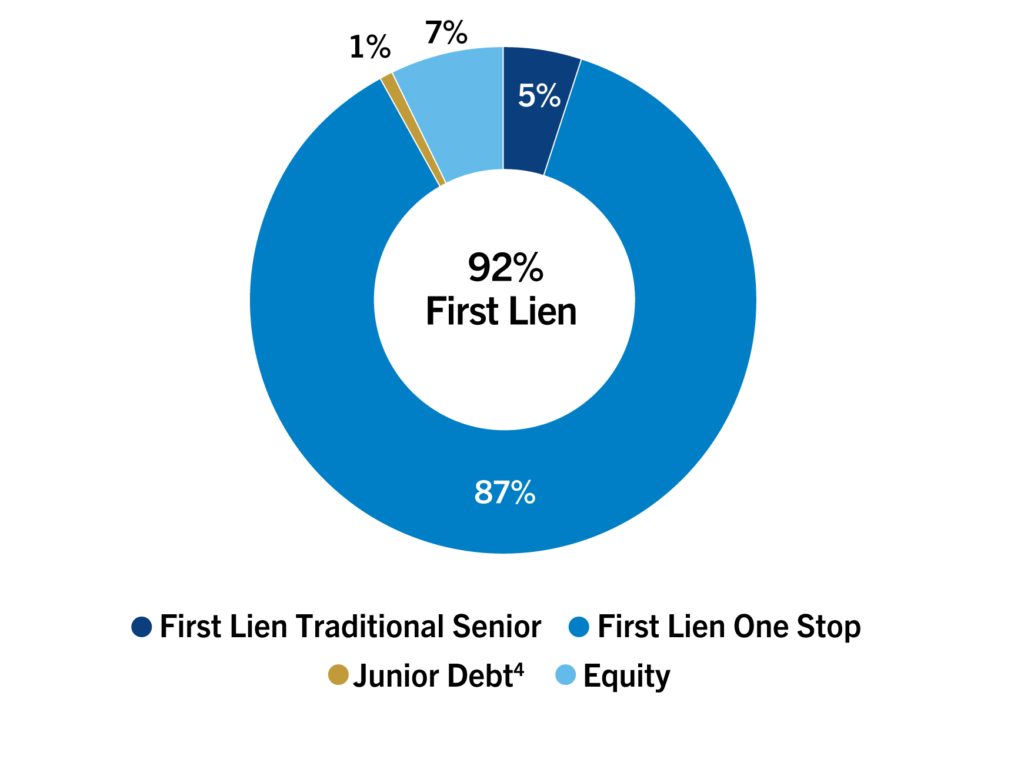
Portfolio Composition by Seniority
92% First Lien
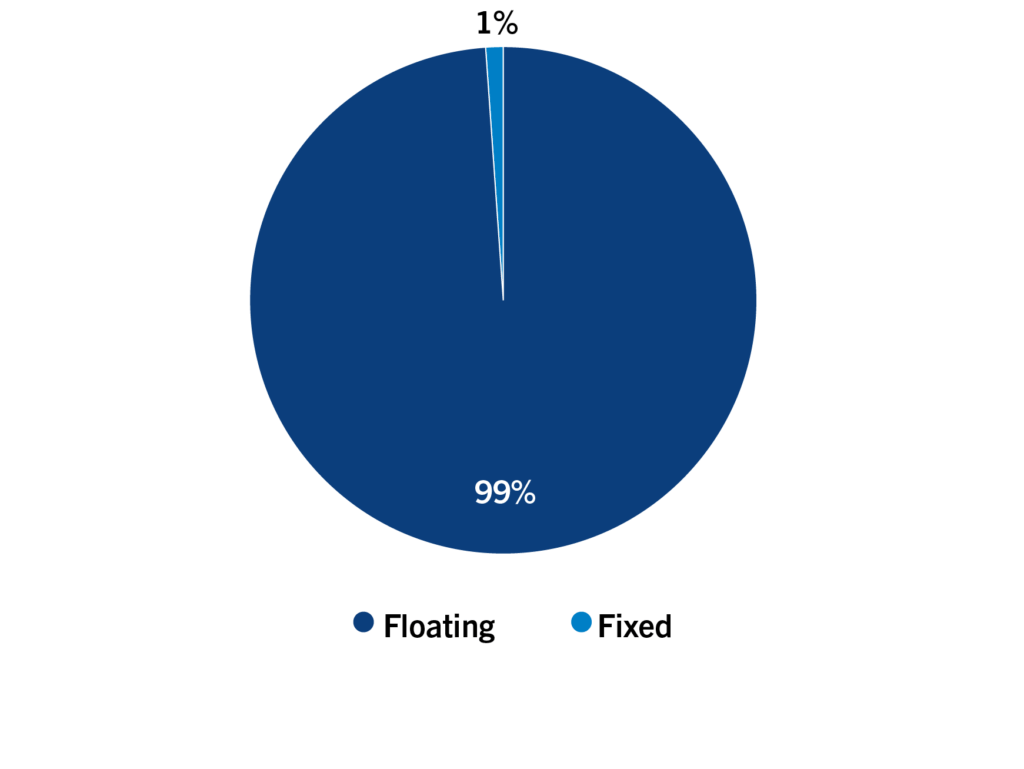
Portfolio Composition by Loan Interest Rate Type5
99% Floating Rate Loans
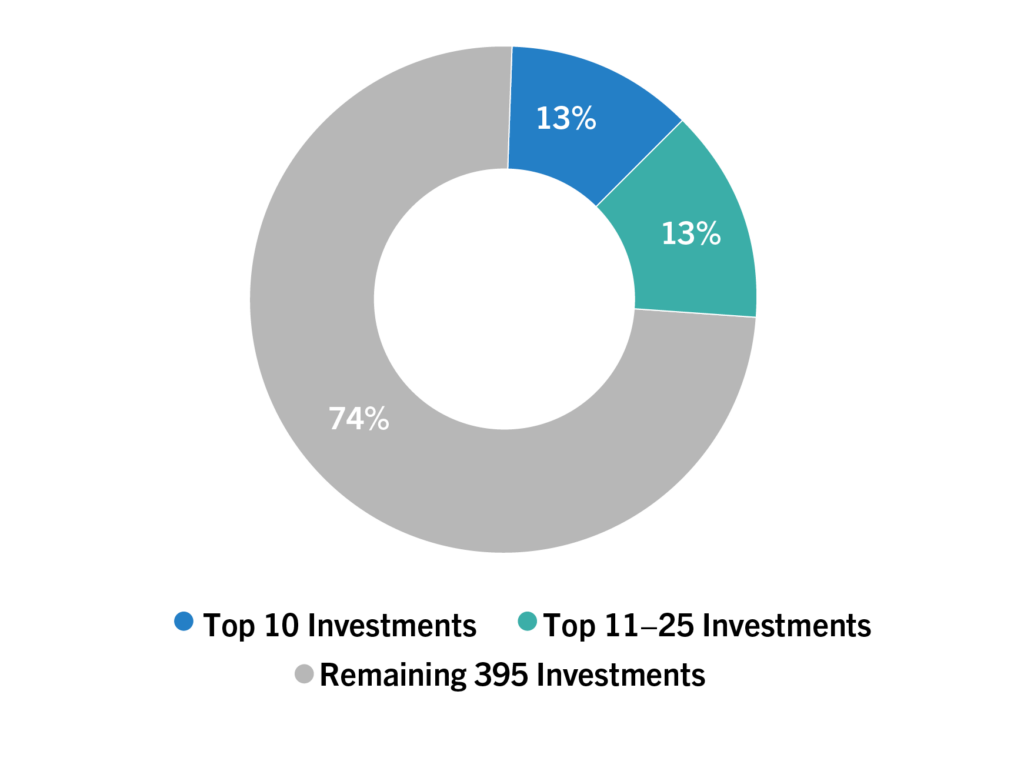
Diversification by Obligor
420 Investments
0.2% Average Investment Size
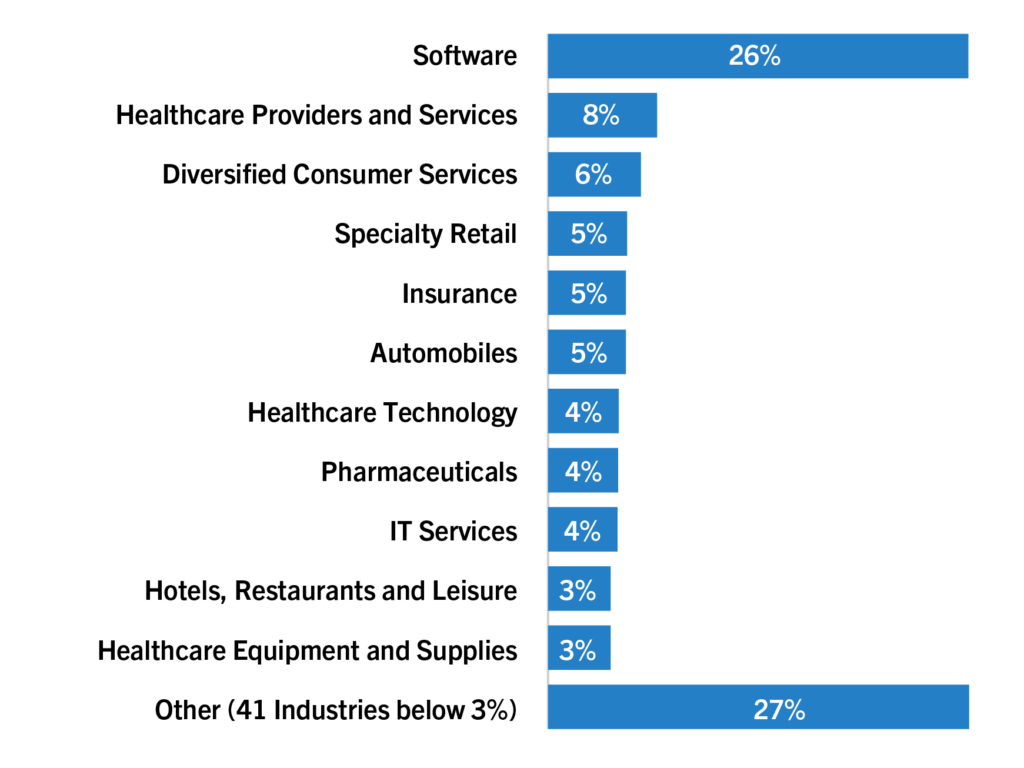
Diversification by Industry6
Based on fair value of investments as of March 31, 2026 unless otherwise noted.
- As of March 31, 2026. The BDC peer group utilized by Golub Capital is the 15 largest publicly traded, externally managed BDCs by total balance sheet assets, excluding GBDC. Golub Capital has selected this group of BDCs for comparison because the Firm believes that the group represents companies that have a similar structure and size as GBDC. Source: SEC Filings.
- As of March 31, 2026. GBDC has 0.2% average investment size vs. 0.5% for the BDC peer group. Calculated based on each BDC’s total investment portfolio size and average portfolio company investment size at fair value. Source: SEC Filings.
- As of March 31, 2026. GBDC has 92% first lien portfolio composition vs. 80% average for the BDC peer group. Source: SEC Filings.
- Junior debt is comprised of second lien and subordinated debt.
- The percentage of fixed rate and floating rate loans is calculated using total debt investments at fair value and excludes equity investments.
- Based on S&P 2018 industry code. The largest industries represented as a percentage of the portfolio at fair value are labeled. All other industry segments are each below 3%.
We have based the above statements on information available to us on the date of March 31, 2026 unless otherwise noted, and we assume no obligation to update any such statements. Future results could differ materially from historical performance. Although we undertake no obligation to revise or update any of these statements, whether as a result of new information, future events or otherwise, you are advised to consult any additional disclosures that we may make through reports that we have filed or in the future may file with the Securities and Exchange Commission (“SEC”), including annual reports on Form 10-K, quarterly reports on Form 10-Q and current reports on Form 8-K.
The above statements contain statistics and other data that have been obtained from or compiled from information made available by third-party service providers. We have not independently verified such statistics or data.